
“Let’s be honest, the easiest way to find the height of tide in one of the Solent’s many harbours is to use an app. But for those who prefer to take the more traditional approach, students on a training course or exam candidates, the good old tidal curve is needed.
If you’re visiting one of the Solent’s many anchorages or rivers then you’re also likely to need to do three secondary port calculations before you have the information needed to complete the tidal curve: 1) the time of high or low water, 2) the height of high water and 3) the height of low water.
Below, I explain my quick method to calculate secondary port info using secondary port grids … and there’s not a crocodile tooth in sight!”
Alex., Chief Instructor at HPSS
Secondary port grids
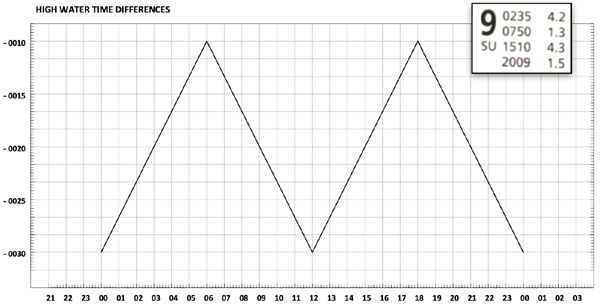
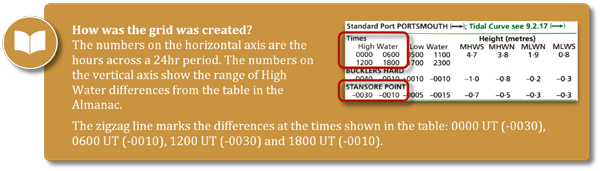
Below is a High Water Time Differences grid that I’ve created to help interpolate the time difference for high water at the entrance to Beaulieu River (Stansore Point). Portsmouth is the Standard Port for Stansore Point so the insert is an extract from a tide table such as those found in Reeds Nautical Almanac.
Step by step
- Mark the time of Portsmouth HW on Sunday 9th August (1510 UT) along the bottom axis of the High Water Time Differences grid.
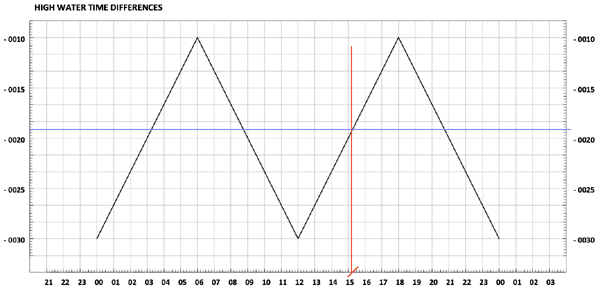
- Draw a vertical line (red) upwards from this mark.
- Draw a horizontal line (blue) from the point where the vertical line and the zigzag line meet.
- Read the time difference from the vertical axis and round this up or down to the nearest whole minute. This is -19 minutes in the example. Therefore the afternoon HW at the entrance to Beaulieu River on will occur at 1451 UT (1510 UT – 19 minutes).
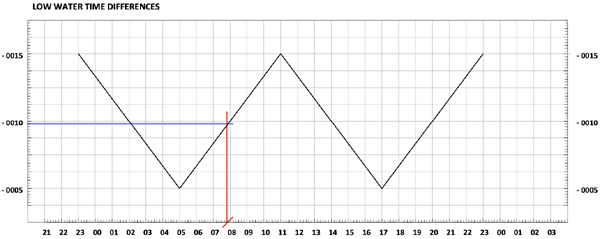
- Follow the same process to find the low water time difference between Stansore Point and Portsmouth. This requires the Portsmouth low water time of either 0750 or 2009 UT and the Low Water Time Differences grid. The example uses the 0750 UT low water and shows that low water at Stansore Point will happen at 0740 UT, 10 minutes earlier than in Portsmouth.
- Use the High Water Height Differences grid and follow the same steps to calculate the difference for the height of high water. The height of HW in Portsmouth at 1510 UT is 4.3m. Mark this along the bottom axis then draw a vertical line upwards.
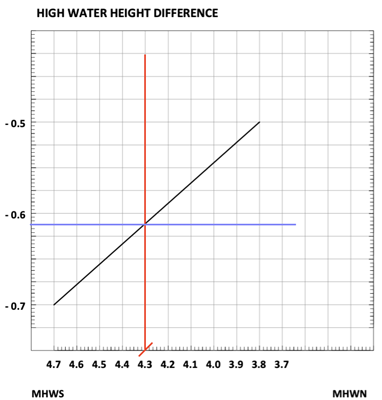
- Draw a horizontal line from where the vertical line meets the diagonal line and read the height difference from the vertical scale. In the example, the difference is – 0.6m. This means that the height of high water at Stansore Point will be 0.6m less than in Portsmouth. (4.3m – 0.6m = 3.7m)
- The final step is to find the Low Water Height Difference. This one is easy as the differences table tell us that regardless of the height of low water in Portsmouth it will be 0.3m less at Stansore Point.
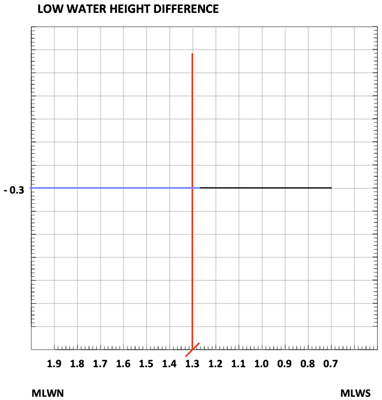
- Therefore the height of low water at Stansore Point is 1.0m (1.3m – 0.3m)
You now have the data needed to complete a tidal curve. Download copies of the tidal curves for Portsmouth and Southampton using the links below.
Download secondary port grids
 A selection of pre-prepared secondary port grids in PDF format are available to download:
- Beaulieu River entrance (Stansore Point)
- Yarmouth & Newtown Creek
- Itchenor (Chichester Harbour)
- Blank secondary port grid so that you can create your own for other ports.
Latest News
Early Booking Discount
Whatever your sailing aspirations might be for the coming year, whether you're looking to build your c
Gift Vouchers
Gift Certificates make the perfect present for any sailing enthusiast. Treat your friend or loved one
The perfect refresher course!
We often hear from skippers who are feeling a little 'rusty', whether it be a dip in confidence, lack
.


Student Comments
.